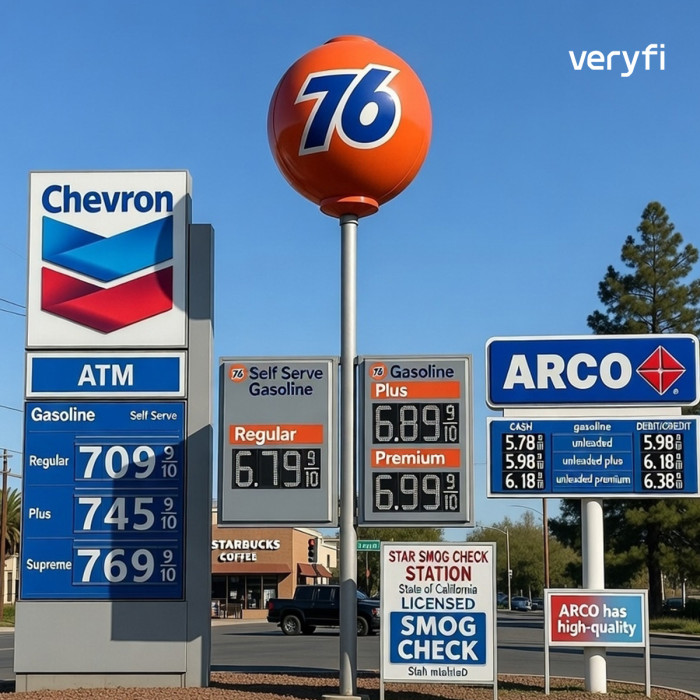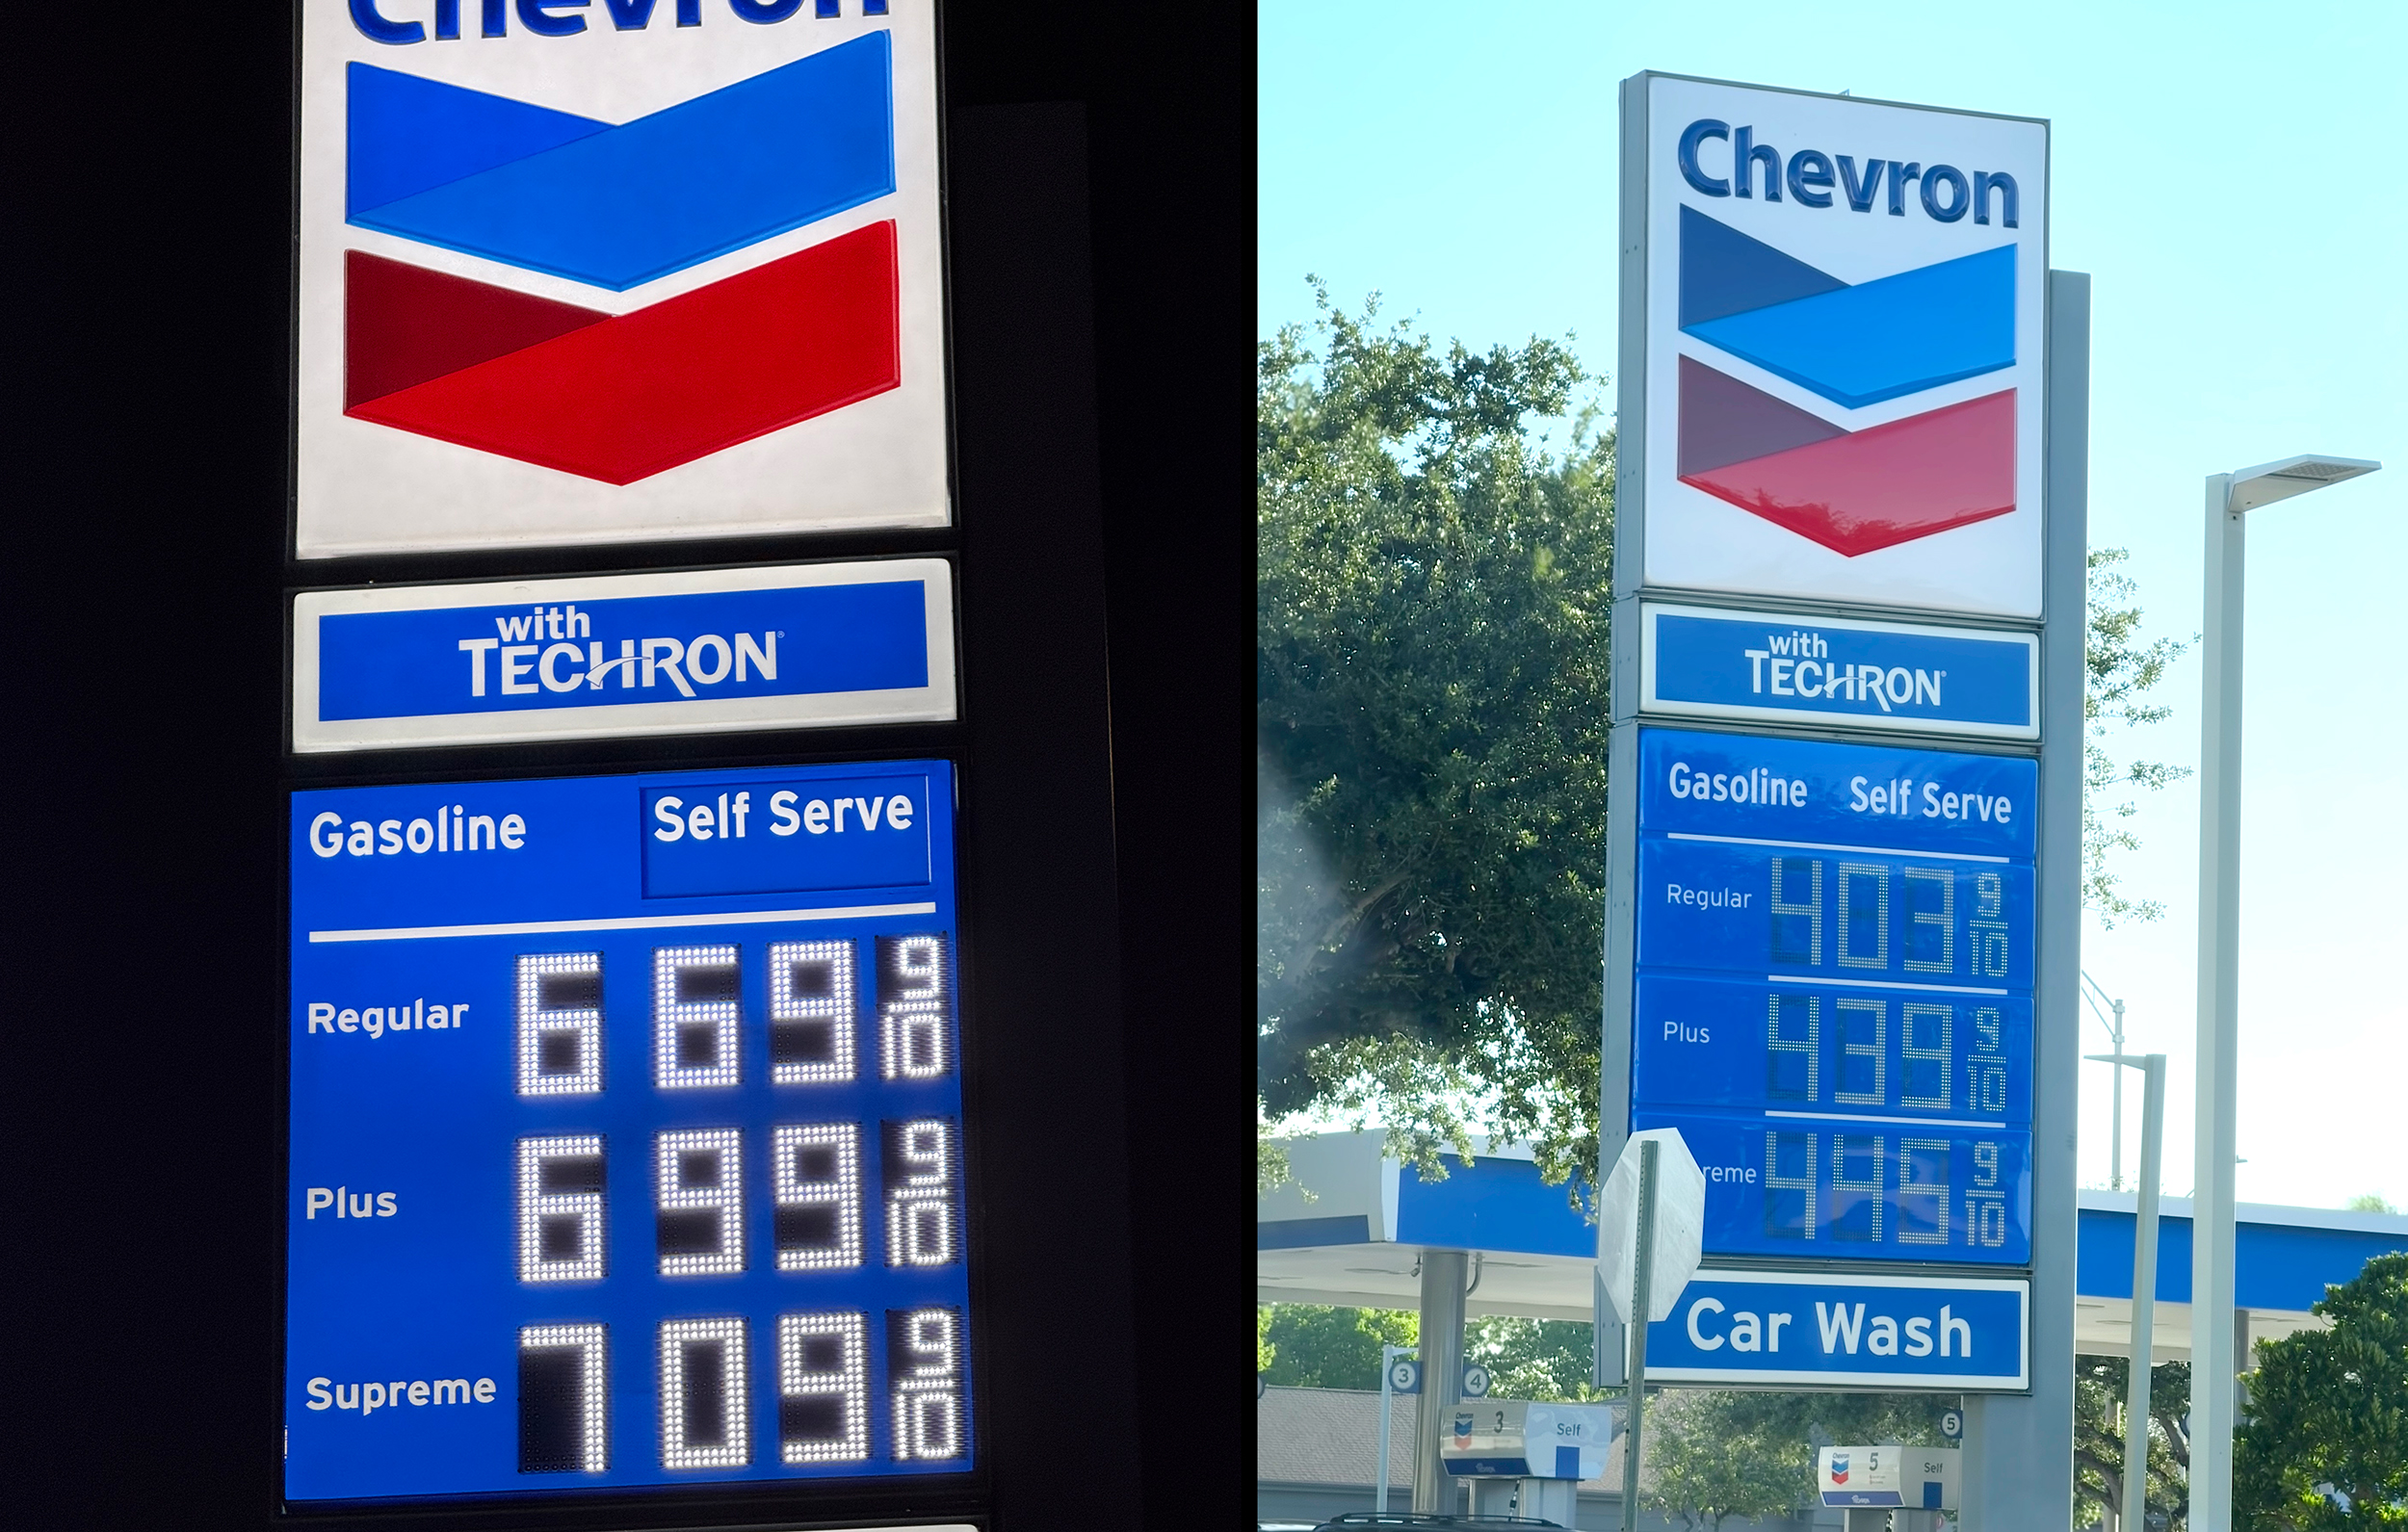
I didn’t set out to write about gas taxes. I just happened to fill up at a Chevron in California, then a day later on a visit to Miami to attend the LATAM CPG Summit, at a Chevron in Miami, and the price difference stopped me in my tracks. Same brand, same Techron-branded pumps, same self-serve setup. Regular was $6.69 a gallon in California. In Miami, it was $4.03.
A $2.66 gap on identical fuel from the identical company felt like it deserved an explanation beyond “California has crazy taxes.” So I dug into it. Taxes are part of the story, and California’s really are the highest in the country, but they turned out to be a smaller part of this particular gap than I expected.
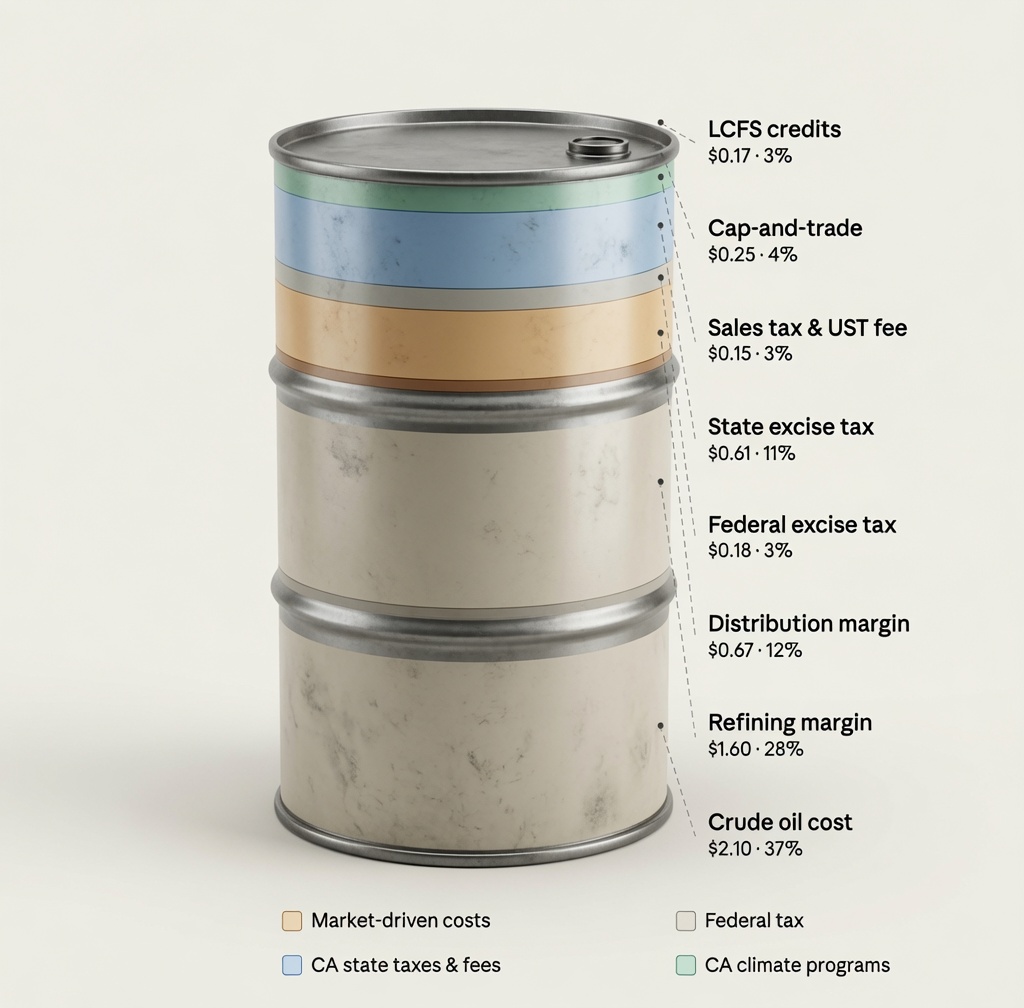
If you read my previous post on gas prices here then you know I’ve been tracking my fuel costs using receipts and Veryfi’s APIs for a very long time. The image below is an updated visualization of where we are today. Yeah it’s painful considering what I saw in Miami where fuel was more than $2 cheaper.

What’s actually inside a gallon of gas
Before comparing states, it helps to know what’s in the barrel to begin with. The California Energy Commission publishes an official monthly breakdown of what makes up the average price at the pump, and the most recent figures, for April 2026, when the statewide average was $5.73 a gallon, split into eight pieces.
| Component | Type | $/gallon | Share | What drives it |
|---|---|---|---|---|
| Crude oil cost | Cost | $2.10 | 37% | Set by the global oil market (Brent/WTI), moved by OPEC+ supply decisions, geopolitical events, and worldwide demand. Same baseline cost no matter which state refines it. |
| Refining margin | Cost | $1.60 | 28% | The cost and profit of turning crude into California’s required cleaner-burning fuel blend. |
| Distribution & retail margin | Cost | $0.67 | 12% | Trucking fuel from the terminal to the station, plus station operating costs and retailer profit. |
| State excise tax | Tax | $0.61 | 11% | California’s flat per-gallon tax, the highest state rate in the country, funding highway and transit projects. |
| Cap-and-trade | Fee | $0.25 | 4% | Carbon allowances that fuel suppliers must buy at state auction to cover the emissions the fuel will produce once burned. |
| Federal excise tax | Tax | $0.18 | 3% | A flat 18.4 cents per gallon in every state, funding the federal Highway Trust Fund. |
| LCFS credits | Fee | $0.17 | 3% | California’s Low Carbon Fuel Standard, which requires fuel providers to blend in lower-carbon fuel or buy offsetting credits. |
| Sales tax & UST fee | Tax/fee | $0.15 | 3% | A partial state sales tax on fuel plus a 2-cent fee that funds cleanup of leaking underground storage tanks. |
Add it up and taxes and fees come to about $1.36 of that $5.73, roughly a quarter of the price. The other three-quarters is crude oil, refining, and distribution, the part of the price that has nothing to do with the legislature.
The real-world test
That’s the statewide average. My own receipts were a more specific data point, and a useful one, because comparing the same brand in two states cancels out a lot of noise. No retailer markup difference to account for, no off-brand pricing quirks. Just California Chevron versus Florida Chevron, regular grade, self-serve, side by side.
| Component | Type | California ($6.69) | Florida/Miami ($4.03) | What drives it |
|---|---|---|---|---|
| Crude oil cost | Cost | $2.10 (31%) | $2.10 (52%) | The same global benchmark price applies in both states. |
| Refining & distribution margin | Cost | $3.21 (48%) | $1.33 (33%) | California’s is inflated by the CARB-blend requirement, an isolated market with no inbound pipelines, and the recent closure of two refineries. Florida’s stays low thanks to cheap Gulf Coast refining and delivery via the Colonial Pipeline. |
| State excise tax | Tax | $0.61 (9%) | — | California’s flat per-gallon tax. |
| State & local fuel tax | Tax | — | $0.42 (10%) | Florida’s combined motor fuel tax, SCETS tax, and county option taxes. |
| Cap-and-trade | Fee | $0.25 (4%) | — | No equivalent program in Florida. |
| Federal excise tax | Tax | $0.18 (3%) | $0.18 (5%) | The same flat federal rate everywhere. |
| LCFS credits | Fee | $0.17 (3%) | — | No equivalent program in Florida. |
| Sales tax & UST fee | Tax/fee | $0.17 (3%) | — | Florida doesn’t apply a general sales tax to gasoline at all. |
| Total taxes & fees | $1.38 (21%) | $0.60 (15%) | ||
| Pump price | $6.69 | $4.03 |
Here’s the number that actually surprised me. Of the $2.66 gap, only about $0.78 of it, roughly 29%, comes from the difference in taxes and fees. The other $1.88, about 71%, comes from refining and distribution, since the crude oil input cost is identical in both states. The “crazy California taxes” framing isn’t wrong; California genuinely has the highest state gas tax in the country. It’s just not what’s mainly driving this $2.66 gap. The bigger story is what it costs to turn crude into gasoline and get it to the pump in a state with its own fuel blend, no incoming pipelines, and, as of this spring, two fewer refineries than it used to have.
How the stack got built
None of this showed up overnight. Every line in these tables has its own legislative history, and most of them are newer than people assume.
| Component | First introduced | Key milestones since |
|---|---|---|
| Federal excise tax | 1932, at 1 cent/gallon | Set to its current 18.4 cents in 1993 and hasn’t moved since. |
| California state excise tax | 1923, at 2 cents/gallon | Doubled to 18 cents under Proposition 111 (1990–94); restructured in the 2010 “fuel tax swap”; raised again by 2017’s SB 1, the first base-rate hike since 1994; indexed to inflation every July since 2020. |
| Florida state & local fuel tax | 1921, at 1 cent/gallon | Constitutional Fuel Tax added in 1943; Ninth-Cent local option tax in 1972; the broader Local Option tax and the SCETS tax both date to a 1983 restructuring; most pieces have been CPI-indexed annually since. |
| Sales tax on gasoline (CA) | 1971 | Reduced to its current 2.25% rate in the 2010 tax swap. |
| Underground storage tank fee (CA) | 1989 | Raised from 1.4 cents to 2 cents as part of the 2010 swap. |
| Cap-and-trade | 2013, industrial sectors only | Expanded to cover gasoline and diesel starting January 1, 2015. |
| Low Carbon Fuel Standard (LCFS) | 2011 | Re-adopted in 2015 after a legal challenge; extended through 2030 in 2018; tightened again in late 2024. |
The base excise taxes in both states are close to a century old and started out as modest flat fees for road maintenance. Almost everything that’s widened the gap beyond that, the 2010 sales-tax swap, the underground storage tank fee increase, cap-and-trade, LCFS, arrived within the last 15 to 35 years, layered on top of that older infrastructure-funding system as climate policy.
The takeaway
California’s gas tax really is the highest in the nation, and its climate programs add real cost on top of that. But if the question is why a Chevron sign in California reads $2.66 higher than the identical sign in Miami, taxes only explain about a third of it. The bigger reason is what it costs to refine and distribute gasoline in an isolated market that requires its own fuel blend and just lost two refineries. Both things are true at once. The “crazy taxes” story is real.
Sources: California Energy Commission, California Air Resources Board, California Department of Tax and Fee Administration, Florida Department of Revenue, Florida Department of Transportation.