
Unexpected Shopper Behavior and Trends
U.S. gas prices are one of the most closely-followed consumer price indexes, informing national and state policy decisions, influencing prices for other goods, and serving as a bellwether for the economy. Organizations like AAA have even produced websites dedicated to gas price trends and car trip cost calculators. However, those indexes are typically based on point-of-sale data rather than consumer-volunteered receipts.
Why Receipt Data Yields Valuable Insights
Receipt data contains a wealth of information that can be used to derive insights into consumer shopping behavior, price trends, brand or product affinities, and more. Since the receipt represents everything that a consumer purchased in a single transaction, analysis of the line item details can uncover unexpected relationships between products, incentives, locations, or times of day. Since the receipts provide zero-party data, it can also be considered more representative of real-world consumer shopping dynamics.
Introducing Veryfi Insights
This blog post is the first from Veryfi Insights, a new industry resource focused on uncovering some of the most unexpected and, well, insightful revelations hidden in the vast amount of zero-party data submitted to the Veryfi OCR API Platform. The data doesn’t contain any personally identifiable information (PII) of the consumers. However, the value of the receipt data is immense, as Veryfi customers have learned by analyzing their own data and using that information to increase loyalty and revenue growth.
Using receipt data, companies can gain insight into:
- Return on Investment (ROI) for promotional campaigns
- Price sensitivity for purchases on specific basket items
- Brand affinities across the entire basket
- Shopper insights, such as time of day purchasing behavior
- Competing product purchases within the same basket
What we learned by looking at gas prices
So, what insights did we gain from looking at 2022 U.S. gas price data in the Veryfi platform?
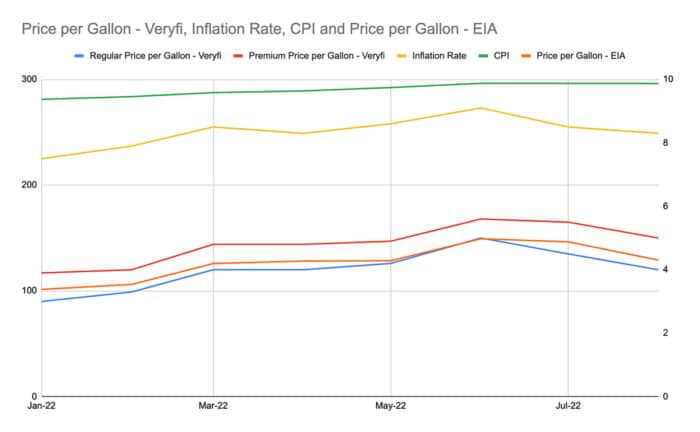
The monthly gas price trends visible from receipt data closely mirrors the data available from other sources. And, it is also influenced by the Russian invasion of Ukraine on February 24th, as the trend line rises dramatically in March. It also aligns with the overall inflation rate in the U.S. economy, as well as the Consumer Price Index (CPI).
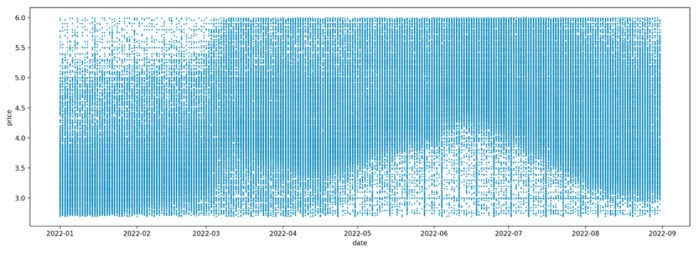
Because we saw a very high degree of variability in the price per gallon data, we suspected that the price varied greatly based on State, Vendor, and Fuel Type (Regular, Premium, Diesel).
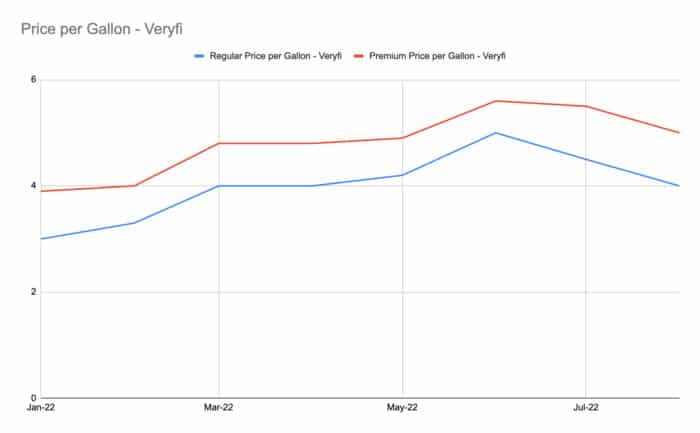
With the receipt data that’s available to Veryfi, we were able to dive deeper into this price variability and examine differences based on State, Vendor, and Fuel Type. Looking at the data, we saw that Fuel Type prices for Regular and Premium consistently differed by around $1.00. So, we decided to chart the monthly trend separately for each of those fuel types, shown below.
Transparency and Trust
Offering Veryfi Insights as an industry resource is a natural extension of our company values of transparency and trust. We believe that providing these ongoing discoveries will help you unlock new ways to connect with your customers, increase their brand trust and loyalty, and fuel greater success in your business.
Learn About the Value of a Receipt
If you’d like to download more details about the value of receipt data, we’ve produced an infographic that illustrates the fundamental concepts:
- What Data Do Receipts Contain?
- What Insights Do Receipts Provide?
- How Can You Transform Insights Into Revenue Growth?